Topics & Trends
Operational Analytics
Customizable Charts
with SupportLogic SX Support Analytics
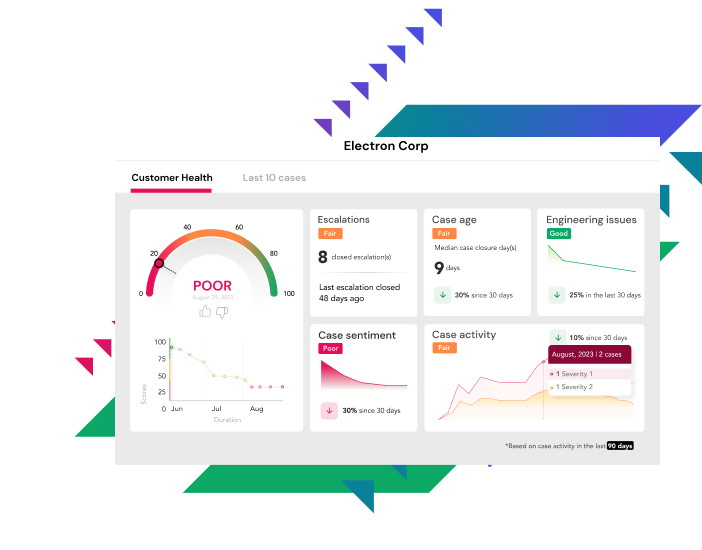
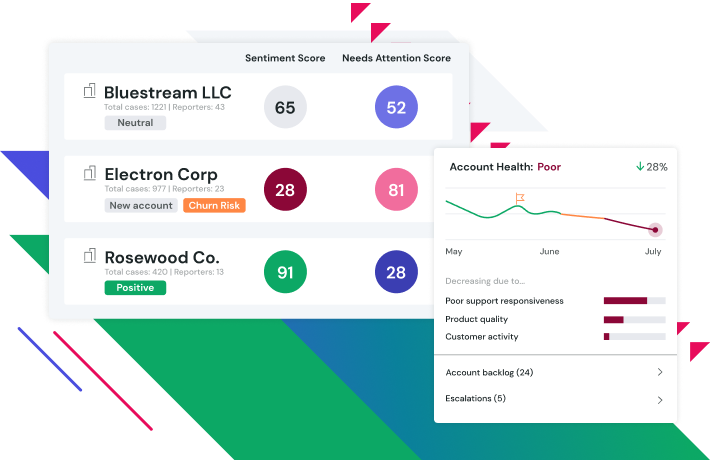
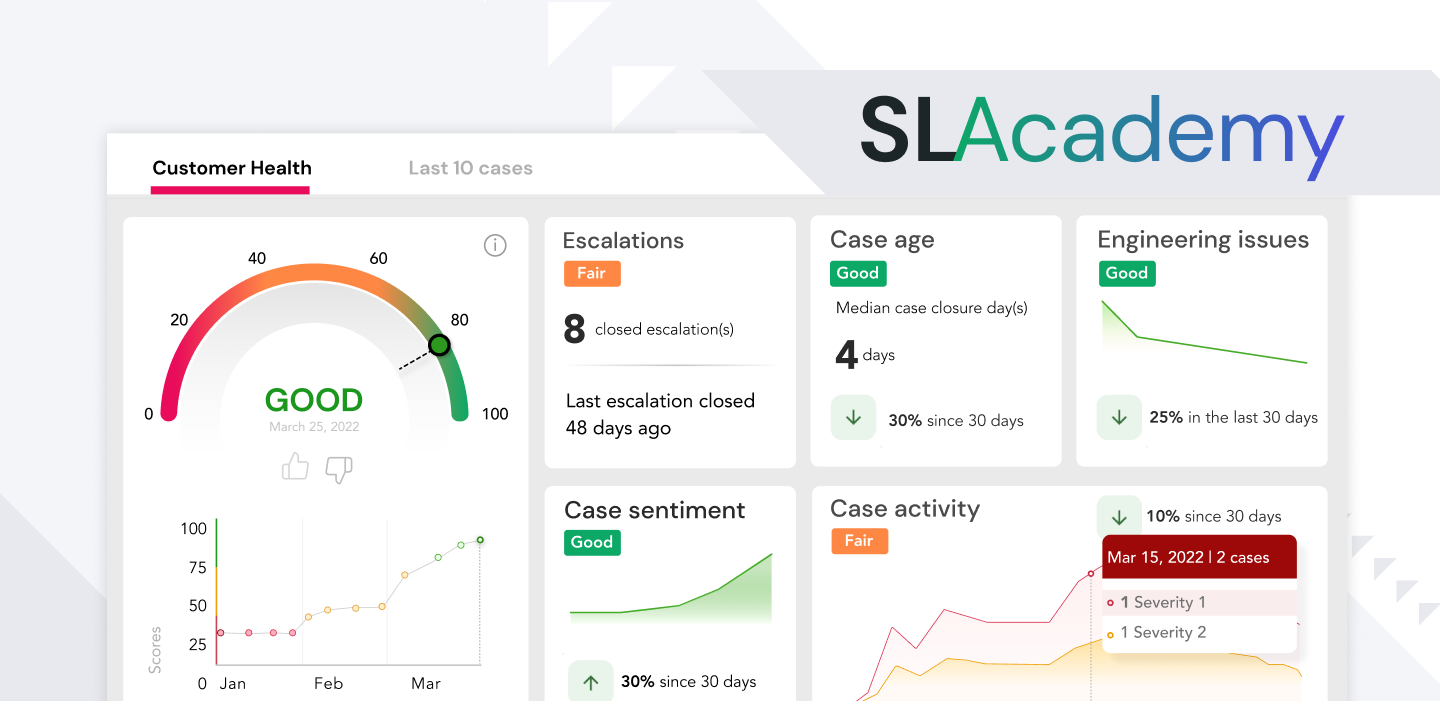
Track inbound sentiments from your customers and outbound sentiments from your agents. Get a bird’s eye view of all sentiments, or drill down to the individual ticket or conversation.
See what keywords are trending. Search for tickets containing any of your domain specific keywords. Roll up multiple keywords into one topic area and produce awesome reports!
Drill down to the individual cases with full case details. You never have to second guess why a particular trend looks anomalous.
Discover outliers and anomalies that you knew existed but couldn’t identify without AI. Transform your reporting from delivering data to delivering actionable insights.
Understand which cases are getting resolved quickly, and which ones are not. Identify common patterns among tickets.
Track your customer experience without surveys. If you have an existing CSAT and NPS survey program you can integrate those results into the dashboard and get a holistic picture.
Understand what is driving customer escalations. Identify patterns and slice and dice the data by region, priority or any one of your case fields.
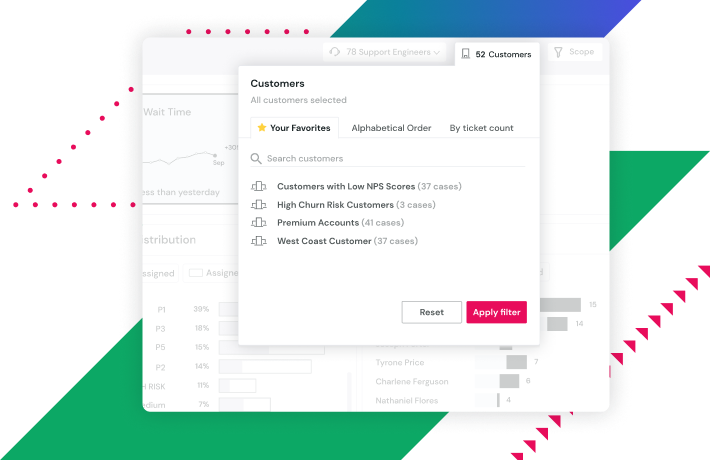
Analyze the efficiency of your support teams. Set your team's goals and priorities, and benchmark their performance. With the drill-down charts identify bottlenecks using drill-down charts with only a few simple clicks.
Configure and track sophisticated Service Level Agreements (SLA) and Service Level Objectives (SLO) without any coding or modifications to the underlying ticketing system.
Map your existing case fields into meaningful representations without any coding or modifications to the underlying ticketing system.
Merge duplicate and redundant case fields to produce powerful dashboards without any coding or modifications to the underlying ticketing system.
See what the SupportLogic SX Platform can do for you.